View slow queries
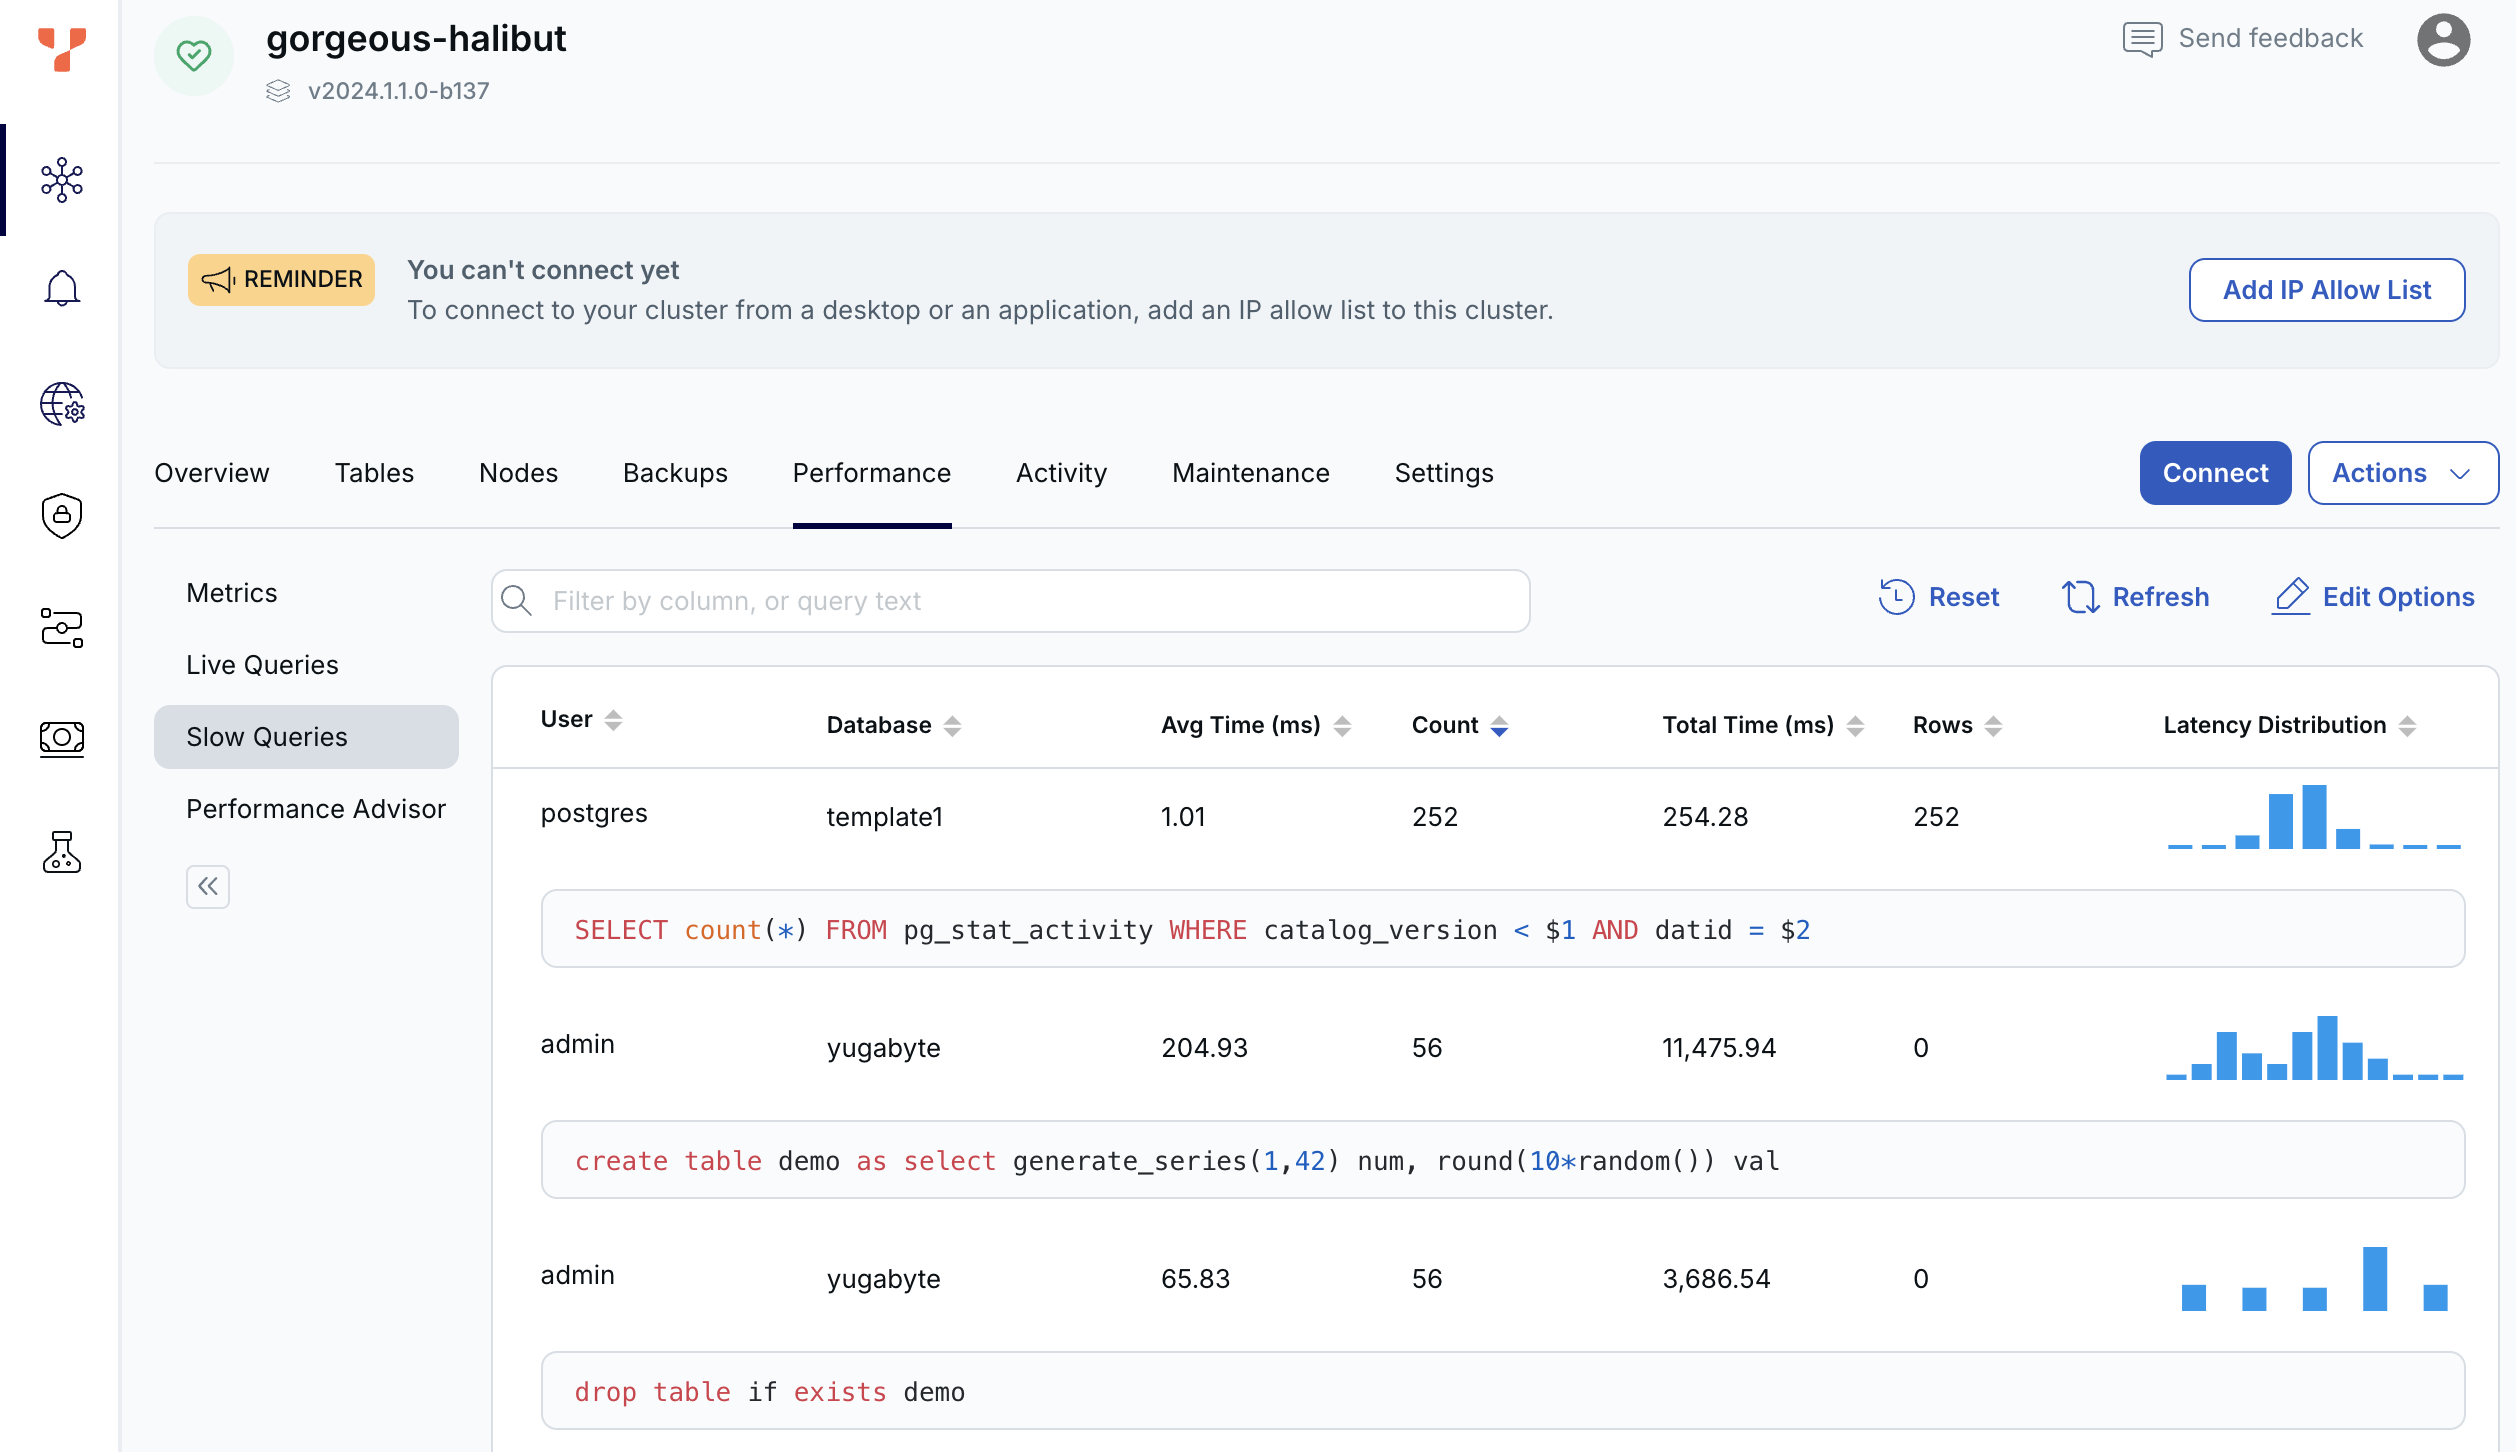
Evaluate the performance of slow queries that have run on your cluster using the Slow Queries option on the cluster Performance tab.
Use this data to:
- Visually identify slower running database operations.
- Evaluate query execution times over time.
- Discover potential queries for tuning.
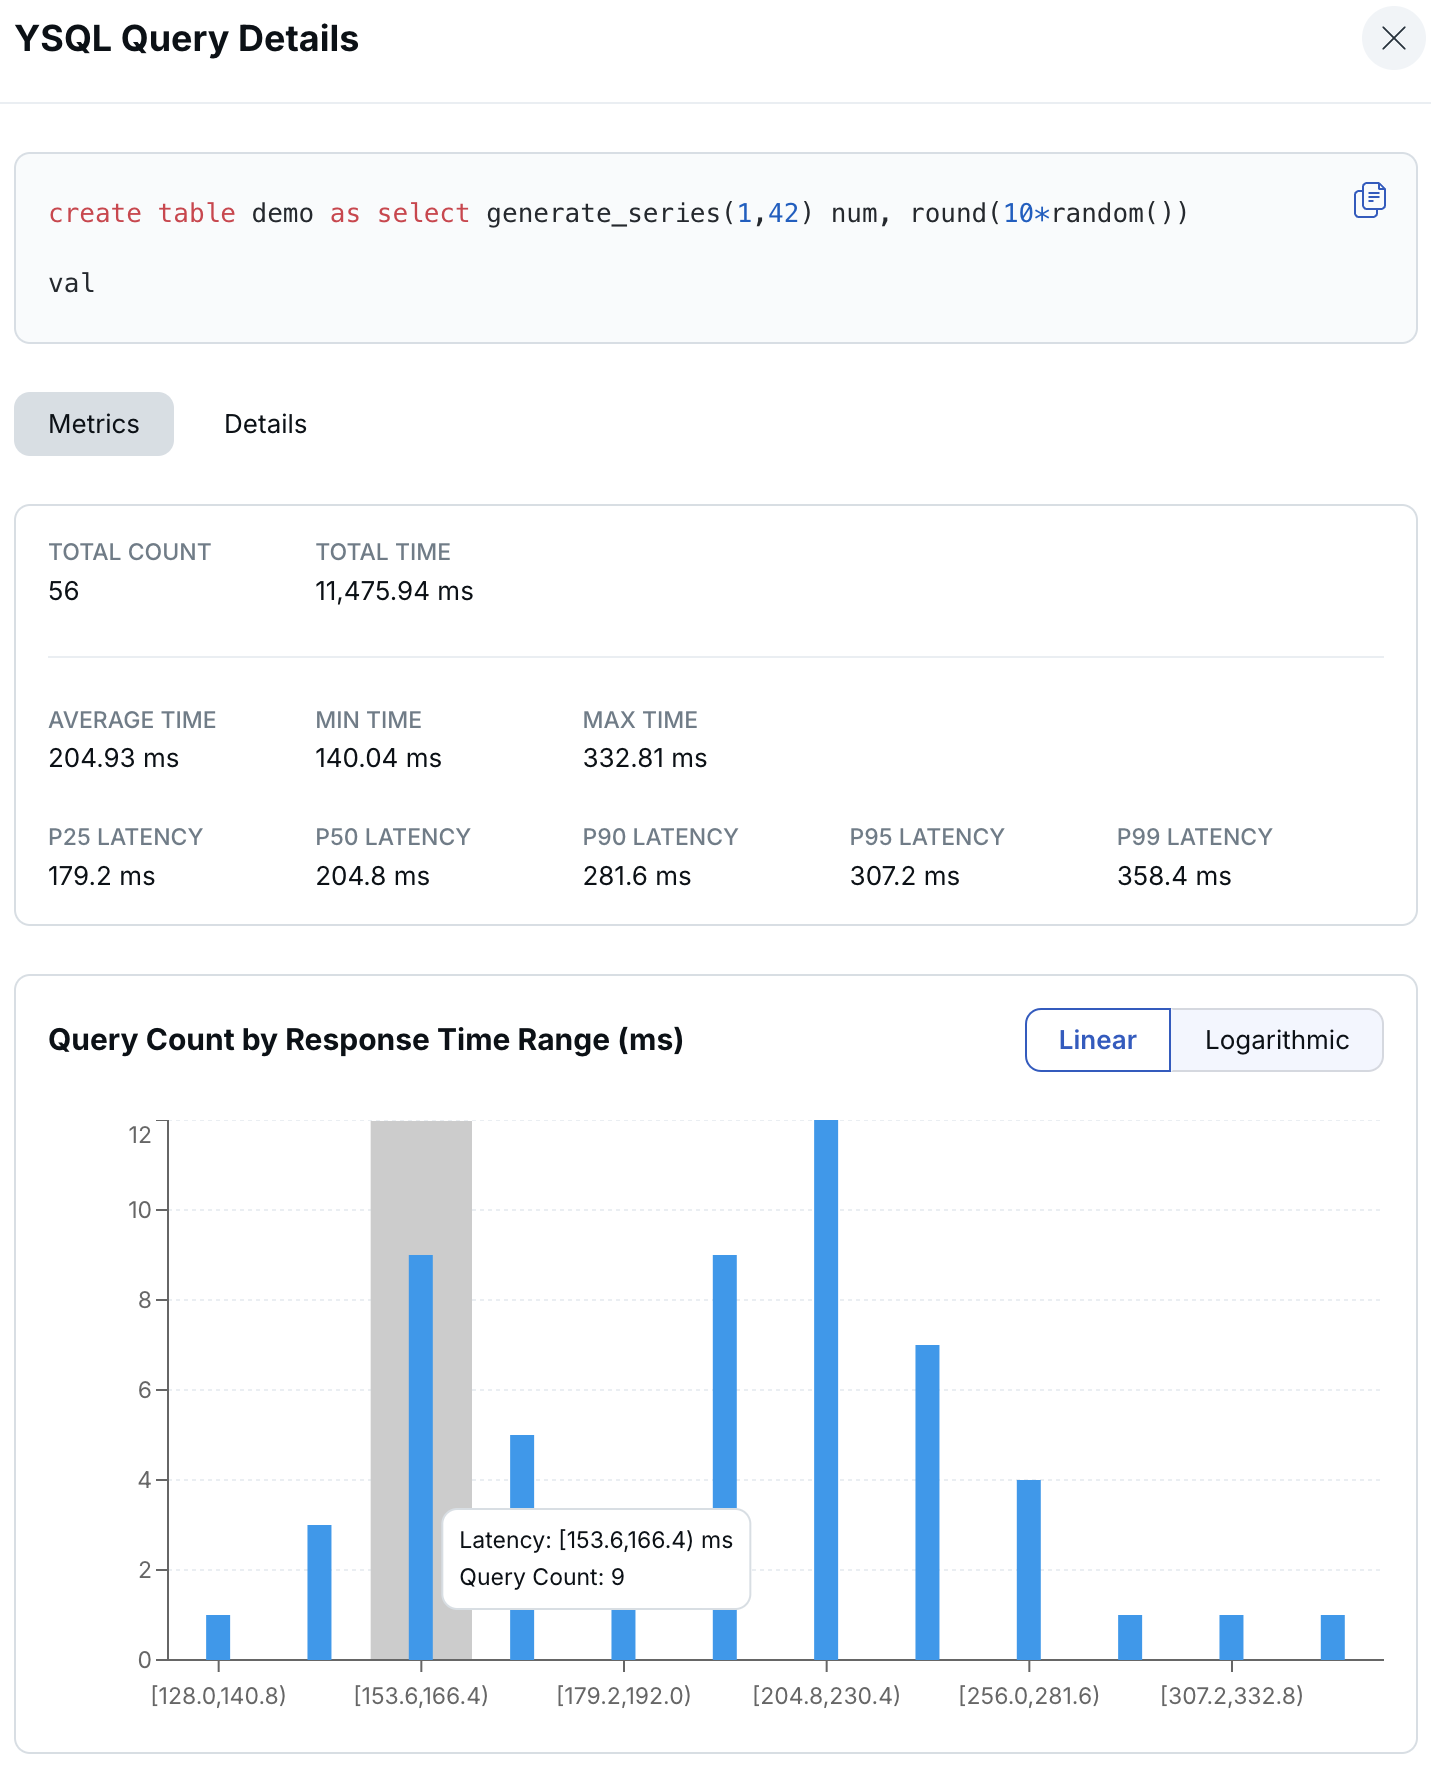
- View latency percentile metrics, including P99, P95, P90, P50, and P25 percentiles.
Slow queries are only available for YSQL.
View Slow Queries
To view slow queries, navigate to the cluster Performance tab and choose Slow Queries.

To filter the query list, enter query text in the filter field. To sort the list by column, click the column heading.
Click Edit Options to select the columns to display. The following table describes the Slow Queries column values.
| Column | Description |
|---|---|
| Query | The query statement. |
| User | The name of role used to access YSQL database. |
| Database | The YSQL database used by the query. |
| Avg time | The average execution time (in milliseconds) for this query. |
| Count | The total number of times this type of query has executed. |
| Total time | The total duration (in milliseconds) of all iterations this query has taken. |
| Rows | The total number of database table rows returned across all iterations of this query. |
| Min time | The minimum execution time (in milliseconds) for this query. |
| Max time | The maximum execution time (in milliseconds) for this query. |
| Latency distribution | Histogram showing the latency distribution of the query. To view a full chart and display P99 percentiles, view the Query Details. |
To reset the slow queries list, click Reset. To update the slow queries list, click Refresh.
Query details
To view query details, click the row for the query to display the Query Details sheet.
The query details show a full view of the query statement, along with all the column data, the P25, P50, P90, P95, and P99 latency metrics, and a chart of the latency histogram. The chart shows the query count by response time range, in milliseconds; linear and logarithmic views are available.
Latency histogram support is only available for clusters running YugabyteDB v2.18.1 or later, or v2.19.1 or later.
